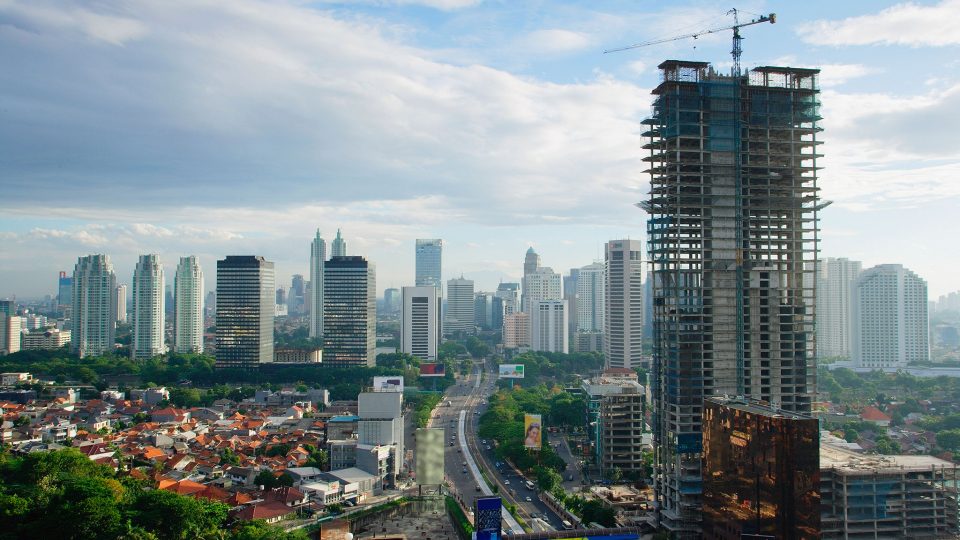
Jones Lang Lasalle, a world leader in real estate services, has published its Jakarta Property Market Update for the first quarter of 2019.
With Indonesia set to become a new economic powerhouse in the Southeast Asian region, overseas property buyers are paying the country more than just a cursory glance. Have a look at the trends between the CBD and non-CBD sectors to better understand the current health of the market.
MACRO OUTLOOK
The fourth quarter of 2018 saw a GDP growth of 5.18 percent. This growth was buoyed this first quarter by a newly operational MRT and an inflation rate of 2.48 percent in March, the lowest rate since November 2009. This is also propped up by a stable benchmark interest rate of 6.0 percent and an improvement of the Rp to 14,160 per USD in April.
THE CBD OFFICE MARKET
Though some firms are located in non-CBD areas, most of the supply of office space is concentrated in several CBD clusters, particularly in Thamrin, Rasuna Said, Satrio, Gatot Subroto, Sudirman, S. Parman, and Mas Mansyur.
CBD Supply
Three towers were completed in 2019’s first quarter: The Millennium Centennial Centre, the Sequis Tower, and the Pakuwon Tower. A total of 565,000 sqm of additional supply is expected to be completed this year; the available supply as of the time of publication was 248,000 sqm.
CBD Demand
Slightly over half (or 55 percent) of all leases signed in the same quarter were by technology and co-working companies. These technology companies encompassed online marketplaces, online gaming, travel booking, and fintech. The rest (45 percent) were occupied by the non-technology segment.
CoHive (26 percent), WeWork (14 percent), Regus (11 percent), and Gowork Indonesia (10 percent) dominated the co-working and serviced office market. UnionSpace, The Executive Centre, Marquee, Kolega, JustCo, and CEO Suite – among others – occupied single digit percentages in the demand pie.
More than four-fifths (86 percent) of this market was situated in the CBD, 90 percent of which were offices.
Quarterly and Annual Net Absorption
With a historical average of 194,000 sqm, approximately 97,500 sqm of net absorption was noted in this year’s first quarter. An expanding tech sector accounted for the improving demand seen in 2017 and 2018. This positive trend is expected to continue this year, despite the upcoming election.
Occupancy and Rents Occupancy
A gradual fall in Grade A rents has been observed since the year 2015; the latest figure is – 1.1 percent q-o-q for Quarter 1 of 2019.
Despite this, JLL has reported an overall encouraging demand for Grade A properties.
The occupancy percentages for the different property grades were stated as follows: Grade C: 92 percent; Grade B: 86 percent; CBD Average: 76 percent; Premium: 70 percent; and Grade A: 65 percent.
Five-Year Market Outlook Occupancy
Occupancy rates will continue to fall in the short term as a result of huge supply volumes. This trend is expected to reverse in the long term due to continuing strong demand and an improvement in occupancy levels as a result of less supply.
CBD 2019 QUARTER 1 OVERVIEW
- New supply of 248,000sqm was recorded this quarter, with more supply expected over the next two years.
- The existing stock at present is 6.4m sqm. A new supply of 0.87m sqm in future is expected.
- CBD occupancy is over three-quarters, or 76 percent.
- A net absorption of 97,500 sqm – or more than half of the historical average of 194,000 sqm – was noted.
- Grade A rents fell to – 1.1 percent q-o-q. The current Grade A rent is Rp277,326 psm pm.
- Rental outlook is falling. Rents are predicted to compress further in 2019 with a measure of stability later in the forecast horizon.
THE NON-CBD OFFICE MARKET
Non-CBD Supply
The non-CBD office market, meanwhile, saw one new completion for the same period. Park Tower Jakarta, in Central Jakarta, stands at ±28,900 sqm and is expected to deliver a total of 311,000 sqm by the end of the year.
Quarterly and Annual Net Absorption
Nearly 40,000 sqm of non-CBD space was absorbed in Quarter 1 of this year. In comparison, the annual average is 107,000 sqm. This is more than half of 2018’s annual absorption of around 75,000.
Non-CBD demand held up well in the consecutive years of 2015 and 2016 when CBD demand was weak.
This quarter’s demand has similarly been observed as healthy.
Occupancy and Rents Occupancy
A continuous rise in occupancy rates (78 percent) was seen in TB Simatupang. Slight increases were likewise discerned in West Jakarta (76 percent) and South Jakarta (81 percent).
Central, East, and North Jakarta’s rates, on the other hand, were seen to be levelling off to 90 percent, 92 percent, and 60 percent respectively.
Non-CBD rents continue to decline; -a 0.4 percent q-o-q was recorded in TB Simatupang.
Supply, Demand, and Rents
After bottoming out three years ago, in 2016, another quarter of steady rises in occupancy was gleaned from the historical trend.
Falling rents and slowing decline is the present trend of the non-CBD market, with South Jakarta rents beginning to stabilise. Next year’s forecast points to rising rents and slowing growth, with supply pipeline front-end loaded in the non-CBD market, along with first recovery stages possible by the end of 2019.
In general, occupancy remains stable; supply matches demand.
NON-CBD 2019 QUARTER 1 OVERVIEW
- New supply of 28,900sqm of was recorded this quarter, and a total of 311,000 sqm is expected by the end of the year.
- The existing stock is 2.8m sqm. A supply of 0.5m sqm in the future is expected.
- Non-CBD occupancy is close to four-fifths, or 78 percent.
- A net absorption of 39,000sqm – or more than half of 2018’s annual absorption of around 75,000 – was noticed.
- Occupancy improved in TB Simatupang, although rents fell to – 0.4 percent q-o-q. The current rent is IDR 115,442 psm pm.
- Rental outlook is steady.


